Last week’s distraction from dumb and annoying news was the famous Slinky Drop experiment, looking at the release of a long soft spring, where the bottom doesn’t move until all the bits above it have relaxed. Here’s that post in fancy Substack-embed form, because the rest of this won’t make much sense without it:
Video Physics: Slinky Drop!
The news has, incredibly, gotten even more stupid and annoying over the last week, providing even more incentive to putter around in the teaching labs using high-speed video to look at basic physics. Last week’s post about eddy currents wasn’t something I’ve seen done a whole lot, but this week is a classic: the ever-popular Slinky Drop.
In the comments last week, Tom Singer said something that made me think it would be fun to see what happened in the case where the spring was much stiffer than a classic slinky. Unfortunately, it’s kind of hard to find stiff springs with any substantial length, let alone ones that will sag under their own weight enough to see the collapse effect. I did a quick trial of chaining together several moderately soft springs that we use for a harmonic oscillation lab, but that didn’t work because once each spring had collapsed to the point where its coils were touching, it started behaving like an independent rigid object, and the chain came apart into individual falling blocks that were rotating. It was a big mess.
That got me thinking, though, about looking at what happens when a single spring is holding up some substantial weight and is suddenly dropped. The physics of the situation suggests that the initial acceleration of the top bit of the dropped spring should be greater than the canonical acceleration of gravity (9.8 meters per second per second), because it’s subject to both the gravitational force acting on its own mass and a downward spring force equal to whatever the weight of the hanging mass is.
So I went in the lab and gave it a try:
This shows a comparison between two of the test masses I used— 500g and 50g— first at a frame rate of 1000 frames per second, and then zoomed in on the very top at 2793 frames per second (because that was the maximum rate for a reasonable resolution). I took a bunch of these and cranked them into Tracker for video analysis:
(That’s a screenshot of a dummy analysis I did at home, because I forgot to bring the actual files with me when I left and I don’t care enough to go back to get them…)
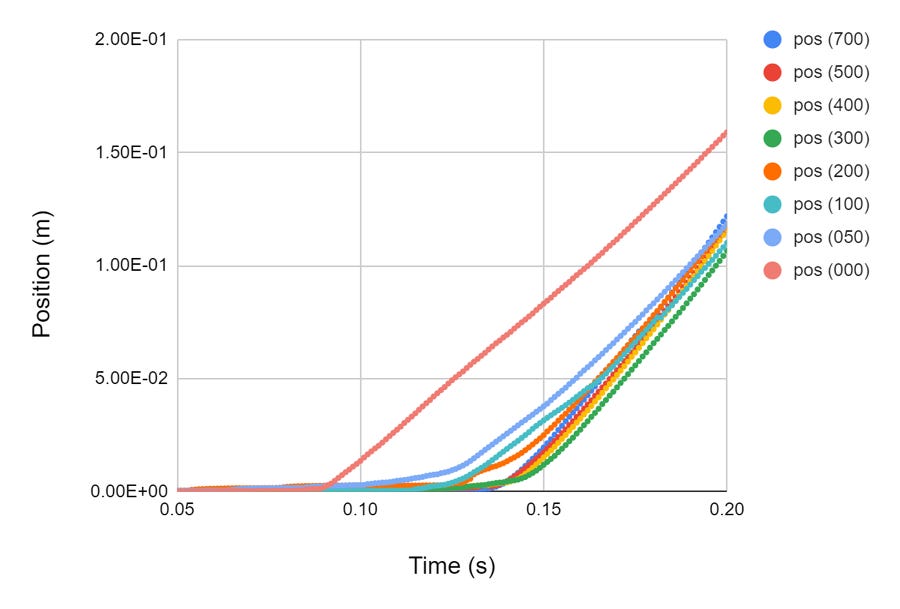
This is done pretty crudely— I’d hit start on the camera, walk a couple of steps to release the string holding the spring, then walk back and stop the camera. As a result, synching these up was a little complicated, but the end result looks like this:
This is a graph of position vs time, from which you can see that the top of the spring moves a lot farther for the heaviest mass use (700 grams) than for the very bottom trace in which there’s no added mass, just the weight of the spring itself. For the heavier masses, you can also see that there’s a kink in the graph near the end, corresponding to the fully relaxed spring striking the hanging mass, which isn’t moving at all. The mass of the spring is around 160 grams, which is why the kink more or less disappears between 100 and 200 g, and for the heaviest masses it actually bounces back a bit.
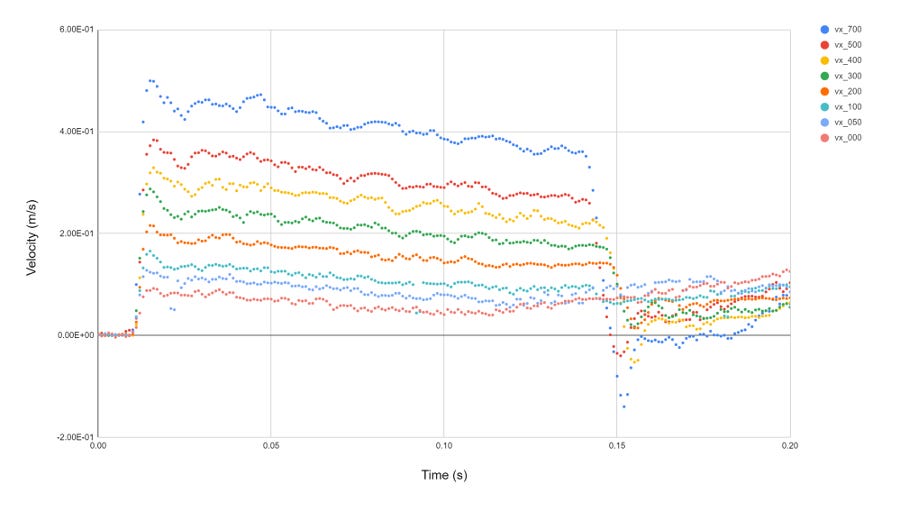
This is even more striking if we look at velocity vs time:
(This is actually what I used to synch them up— I made a dummy time scale and then shifted individual datasets back and forth to put the sharp leading edge of this at the same time for each…)
In every case, we see a sudden rise at the very start of the drop, followed by a slow decline; this is the same physics as in the slinky drop from last week: as each segment of the spring relaxes and joins in the motion, it slows down a little in such a way that the center of mass accelerates downward at the acceleration of gravity. The collision with the hanging mass is visible at the end, when the velocity suddenly drops a lot, and in a few of the heavier cases, actually reverses briefly.
Two things stand out in this, at least from the standpoint of a physicist: 1) the initial speedup takes basically the same time for each hanging mass, and 2) the full drop takes about the same amount of time for each.
I didn’t really have any particular preconception about what the timing of this should be, but it was mildly surprising to me that the duration of the initial acceleration was so similar across such a range of masses. I can sorta-kinda convince myself that this is a thing that ought to depend more on the material properties of the spring and that kind of thing than on the hanging mass per se, but had the empirical data been different I easily could’ve done the same in the other direction. Anyway, this seemed worth checking out, which is what actually motivated the ultra-high-speed video looking at just the top part of the heavy spring:
That’s the velocity vs time for 500g and 50g hanging masses at 2793 frames per second, and, yeah, those are very similar times. There’s maybe a slight difference between them, but I don’t know that I trust the auto-tracking and digitization of this enough to believe that’s a real effect. I could, in principle, slow this down even more, but we’re getting toward the point of diminishing returns with this, so I think I’ll leave it there.
The second point, about the full collapse time being the same for all the masses, is a little messier to check. If I synch up the initial drops as above, but look at the motion of the mass at the bottom, I get this:
Those all seem to start at different times, without a super clear pattern to them, which worried me for a bit until I realized the issue: the one that starts way before the others is a bare spring with no hanging mass, where I measured the position of the end of the spring. The others are all tracking the center of the hanging mass, because that’s much cleaner for the autotracking algorithm to work with. Those masses are hung from the bottom of the spring by hooks, and don’t really start moving until the (now fully collapsed) spring hits the mass, and the hooks aren’t a consistent length. If I re-did this tracking the last coil of the spring instead, I bet I would find those times to be way more similar. (I almost certainly don’t care enough to check this…) So, anyway, my supposition is that these are all the same collapse time, which makes a good deal of sense given what I’ve read about slinky drops.
The other very physics-y question to ask about this is how that initial acceleration scales with the hanging mass. The naïve expectation would be that it should be linear: the force the spring needs to supply to hold up the weight is proportional to its mass, and that same force is responsible for accelerating the top little bit. You could imagine, though, that this gets complicated by some other factor having to do with the details of the spring, etc., which would give a different functional form
We can test that by making an “average acceleration” for each value of the hanging mass by dividing the peak velocity by the time needed to speed up, and end up with the following graph of force vs acceleration:
And, yep, that’s pretty linear. The way this is set up, the slope of that best-fit line looks like an effective mass for the bit being accelerated (about 5.4g), and the intercept is a general offset. The line doesn’t go through the origin because there’s some downward acceleration even with zero hanging mass, which makes sense because the spring itself has mass. And, in fact, if you look at the intercept value for that specific fit, it corresponds to about 153g, where the spring mass (according to the classroom scale) is about 166g. That’s really remarkably good; at a level that I worry might be some kind of coincidence…
The other thing that’s a bit surprising if you dig into it a bit is that those initial acceleration values are huge: you can see it says 1500 m/s/s on the graph above, and a couple of different fits to the values for the 2793fps video give values in excess of 2000 m/s/s for the 500g hanging mass. That’s 200 times the acceleration of gravity, which is kind of incredible…
But then, this is a point where my intuition kind of breaks down: I genuinely don’t have any idea what to think that acceleration “should” be, other than “more than 9.8 m/s/s”. So, this goes in the “Huh, how ‘bout that?” category of surprises, rather than the “Something is wrong, here” bucket.
And, yeah, that’s This Week in How Chad Is Distracting Himself from World Events. I don’t know that this is really useful for anything more; it’s a level of detail about spring physics that we really don’t get into with our intro classes, so I doubt these graphs will turn up on class slides. It was a fun way to pass several mornings, though, and that’s what really matters.
This is super nerdy, I know, but like the previous posts, I think it’s probably useful/interesting as a window into the mindset of an experimental physicist presented with new toy. If you like this, and want more, here’s a button:
And if you see any problems with the analysis, or want to suggest something else I ought to look at in high-speed video, the comments will be open:


