


Geometry of Growth Spurts
It's all about angles...

In yesterday’s Nerd Parenting blog post, I noted that when I plot The Pip’s height as a function of time, it comes out to be a remarkably straight line. This despite the common perception that he’s “really shooting up” in height recently. He’s now over 5’7” (confirmed at his annual physical yesterday), and is legitimately taller than some fraction of adults, like this umpire from a baseball game several weeks back:

This, of course, leads me to wondering about why he’s perceived as growing more rapidly in recent months, when he’s actually just plugging along. There are two obvious-ish explanations for this, one of them psychological: as Kate pointed out, he’s gotten thinner as well as getting taller. He’s gotten into general fitness over the last year or so, regularly lifting weights and running on a treadmill in the basement, and eating a bit less junk food than he used to. As a result he’s actually lost weight while getting taller, and the thinning makes the height change seem more extreme.
There’s also a physics-y explanation, which was suggested by Vampyricon in the comments to yesterday’s post, and by a couple of colleagues when I mentioned it yesterday, namely that it’s a matter of angles. That is, the thing adults are comparing to isn’t an absolute height, but an angle of view— “How far do I have to tip my head to see this kid?”
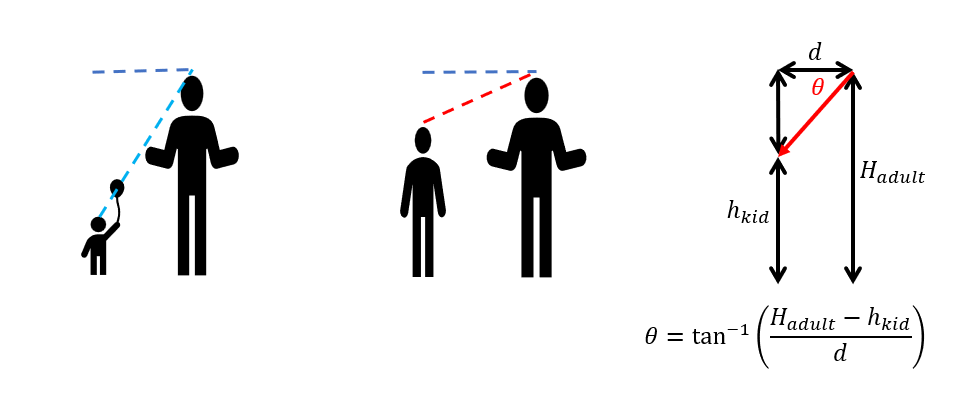
For very young children, a normal adult has to look almost straight down to see the kid, and that doesn’t change very much with a small increase in height. As the kid gets taller, though, the angle gets smaller, and the same change in height corresponds to a bigger change in angle. This is most dramatic when the kid catches and passes the adult— a small change in height makes the difference between looking down slightly and looking up slightly.
I toyed with this a little bit yesterday, but doing it with the actual data was messy; partly because there’s a bit of scatter in the height measurements, partly because the measurements occur at odd intervals, and partly because finding the angle requires calculating the inverse tangent, and that can be a little weird depending on what program you’re using. I ended up dropping it because I had actual work to do, which is why it’s not in yesterday’s post.
It’s a simple enough idea, though, so I came back to it today. To avoid the issues with using the real data, I just simulated it using the best-fit line for The Pip’s height (since we’ve established that it’s a very good linear fit). There are two parameters (other than the kid’s height) that go into the angle calculation: the height of the adult doing the observing, and the distance between them when making the observation. I went with 18” for the latter, as a reasonable ballpark value for standing “right next to” somebody; and calculated the change in angle over time for four different values of the adult height: 77” (about my height), 72” (six feet even), 67” (The Pip’s current height) and 62” (a bit under Kate’s height). The results look like this:

What’s plotted here is the change in viewing angle since the previous measurement (the units would be something like radians per day, but don’t really matter), and you can see that this does, in fact, increase substantially as the kid gets taller, reaching a maximum value when the kid height matches the adult height. (If you do a tiny bit of calculus, the shape of the curve is a Lorentzian, but that’s not really important.) Which would fit with the general pattern of adults exclaiming over The Pip’s seemingly sudden growth, and also that this seems somewhat anti-correlated with height— that is, even before I started making dorky graphs, I was less convinced that he was having a “growth spurt” than many others.
(This is also partly because I never had that experience when I was a teenager— I was just always tall, and grew steadily. Some other guys did seem to go through spurts— as I’ve told The Pip a bunch of times, I was not the first kid in my grade to reach 6’ tall. Two other guys on the 8th grade basketball team were taller than me; by graduation I had 4-5” on both of them.)
As noted above, this assumes a separation of a foot and a half for the angle observation; if you change that, it changes the shape of the curves a little bit— making it larger makes the peak flatter (the max value is lower and the rise less rapid), and making it smaller makes the peak sharper (higher max value, faster rise and fall)— but doesn’t change the basic result that the rate of change in viewing angle goes up significantly, and could be a factor in making adults think that a kid is “really shooting up” when, in fact, they’re just growing steadily.
Anyway, nothing really surprising here, just a verification of the quick impression that people who commonly deal with angular measurements have when the subject comes up. But, you know, it’s nice when intuition corresponds with reality, and playing around with spreadsheets was a fun diversion in a kind of annoying week…
There’s some bonus Nerd Parenting for you. If you like this kind of thing, here’s a button:
And if you want to critique my silly model, or suggest another interpretation, the comments will be open: